- William Roberts Clark & Matt Golder. 2023. Interaction Models: Specification and Interpretation. New York: Cambridge University Press.
Abstract: The radical interdependence between humans who live together makes
virtually all human behavior conditional. The behavior of individuals is
conditional upon the expectations of those around them, and those expectations
are conditional upon the rules (institutions) and norms (culture)
constructed to monitor, reward, and punish different behaviors. As a result,
nearly all hypotheses about humans are conditional – conditional upon
the resources they possess, the institutions they inhabit, or the cultural
practices that tell them how to behave. Interaction Models provides a
standalone, accessible overview of how interaction models, which are
frequently used across the social and natural sciences, capture the intuition
behind conditional claims and context dependence. It also addresses
the simple specification and interpretation errors that are, unfortunately,
commonplace. By providing a comprehensive and unified introduction to
the use and critical evaluation of interaction models, this book shows how
they can be used to test theoretically derived claims of conditionality.
Part I: The Fundamentals
Chapter 2: Theories and Their Conditional Implications
Chapter 3: Interaction Model Specification
Chapter 4: Interpreting Quantities of Interest
Chapter 5: Three Substantive Examples
Part II: More Complex Forms of Conditionality
Chapter 6: When We Have More Than One Modifying Variable
Chapter 7: When an Independent Variable Interacts with Itself
Part III: Interactions and Limited Dependent Variables
Chapter 8: Interactions and Dichotomous Dependent Variables
Chapter 9: Interactions and Ordered Dependent Variables
Chapter 10: Interactions and Unordered Dependent Variables
Complete Replication Code in Stata
[Instructions] [Code]
Complete Replication Code in R
[Instructions] [Code]
- Ray Block, Matt Golder, & Sona N. Golder. 2023. “Evaluating Claims of Intersectionality.” Journal of Politics 85(3): 795-811.
[appendix] [replication files] - William Berry, Matt Golder, & Daniel Milton. 2012. “Improving Tests of Theories Positing Interaction.” Journal of Politics 74: 653-671.
[abstract] [replication files] [online appendix] - Thomas Brambor, William Roberts Clark, & Matt Golder. 2006. “Understanding Interaction Models: Improving Empirical Analyses.” Political Analysis 14: 63-82.
[abstract] [literature survey] - William Roberts Clark, Michael Gilligan & Matt Golder. 2006. “A Simple Multivariate Test for Asymmetric Hypotheses.” Political Analysis 14: 311-331.
[abstract] [replication files]
Below are some recommendations based on information contained in my published articles. These recommendations are expanded upon and extended to new situations in my 2023 book Interaction Models: Specification and Interpretation.
Five Key Predictions
In “Improving Tests of Theories Positing Interaction”, my co-authors and I recommend that scholars try to make as many of the following five predictions as possible when evaluating a simple interaction model such as:

- The marginal effect of X is [positive, negative, zero] when Z is at its lowest level.
- The marginal effect of X is [positive, negative, zero] when Z is at its highest level.
- The marginal effect of Z is [positive, negative, zero] when X is at its lowest level.
- The marginal effect of Z is [positive, negative, zero] when X is at its highest level.
- The marginal effect of each of X and Z is [positively, negatively] related to the other variable.
All five predictions can be subsumed in a single hypothesis about how the marginal effect of X varies with Z and a single hypothesis about how the marginal effect of Z varies with X. For example, you might have:
- The marginal effect of X is positive at all values of Z; this effect is strongest when Z is at its lowest and declines in magnitude as Z increases.
- The marginal effect of Z on Y is positive when X is at its lowest level. This effect declines in magnitude as X increases; at some value of X, Z has no effect on Y. As X increases further, the effect of Z because negative and strengthens in magnitude as X increases.
Specification and Interpretation
In “Understanding Interaction Models: Improving Empirical Analyses”, my co-authors and I make several recommendations about the general specification and interpretation of interaction models:
- Use multiplicative interaction models whenever one’s hypothesis is conditional in nature.
- Include all constitutive terms in the model specification.
- Do not interpret the coefficients on constitutive terms as if they are unconditional marginal effects.
- Do not forget to calculate substantively meaningful marginal effects and standard errors.
In “Improving Tests of Theories Positing Interaction”, my co-authors and I discuss how to interpret several different prototypical sets of results — see pages 7-10.
Marginal Effect Plots
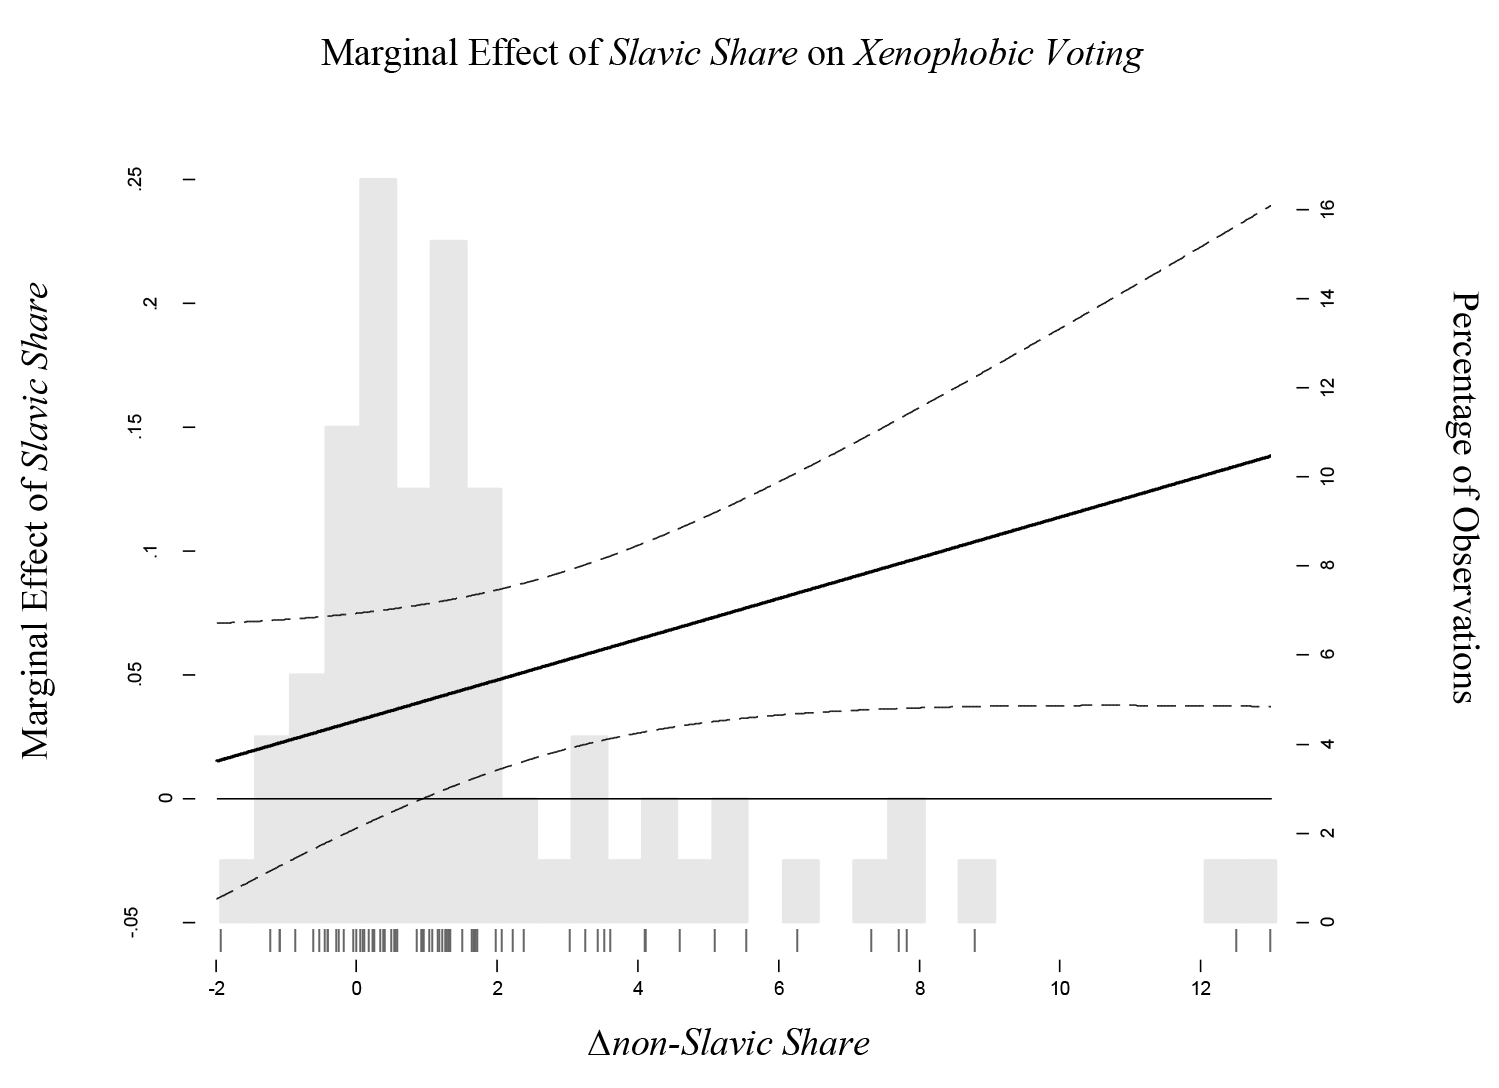
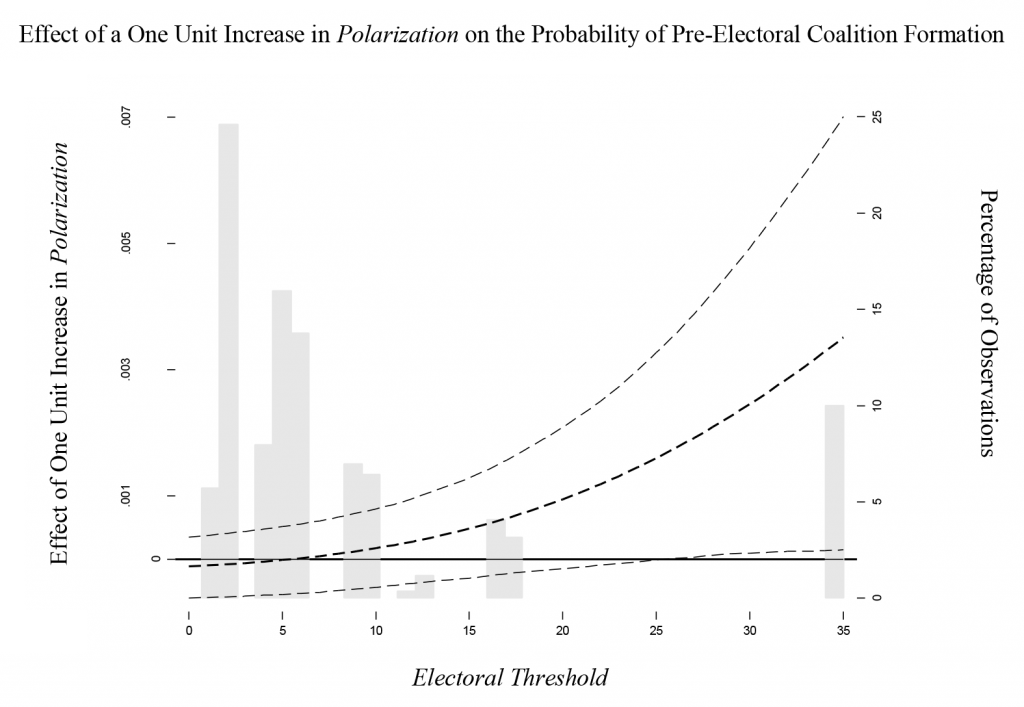
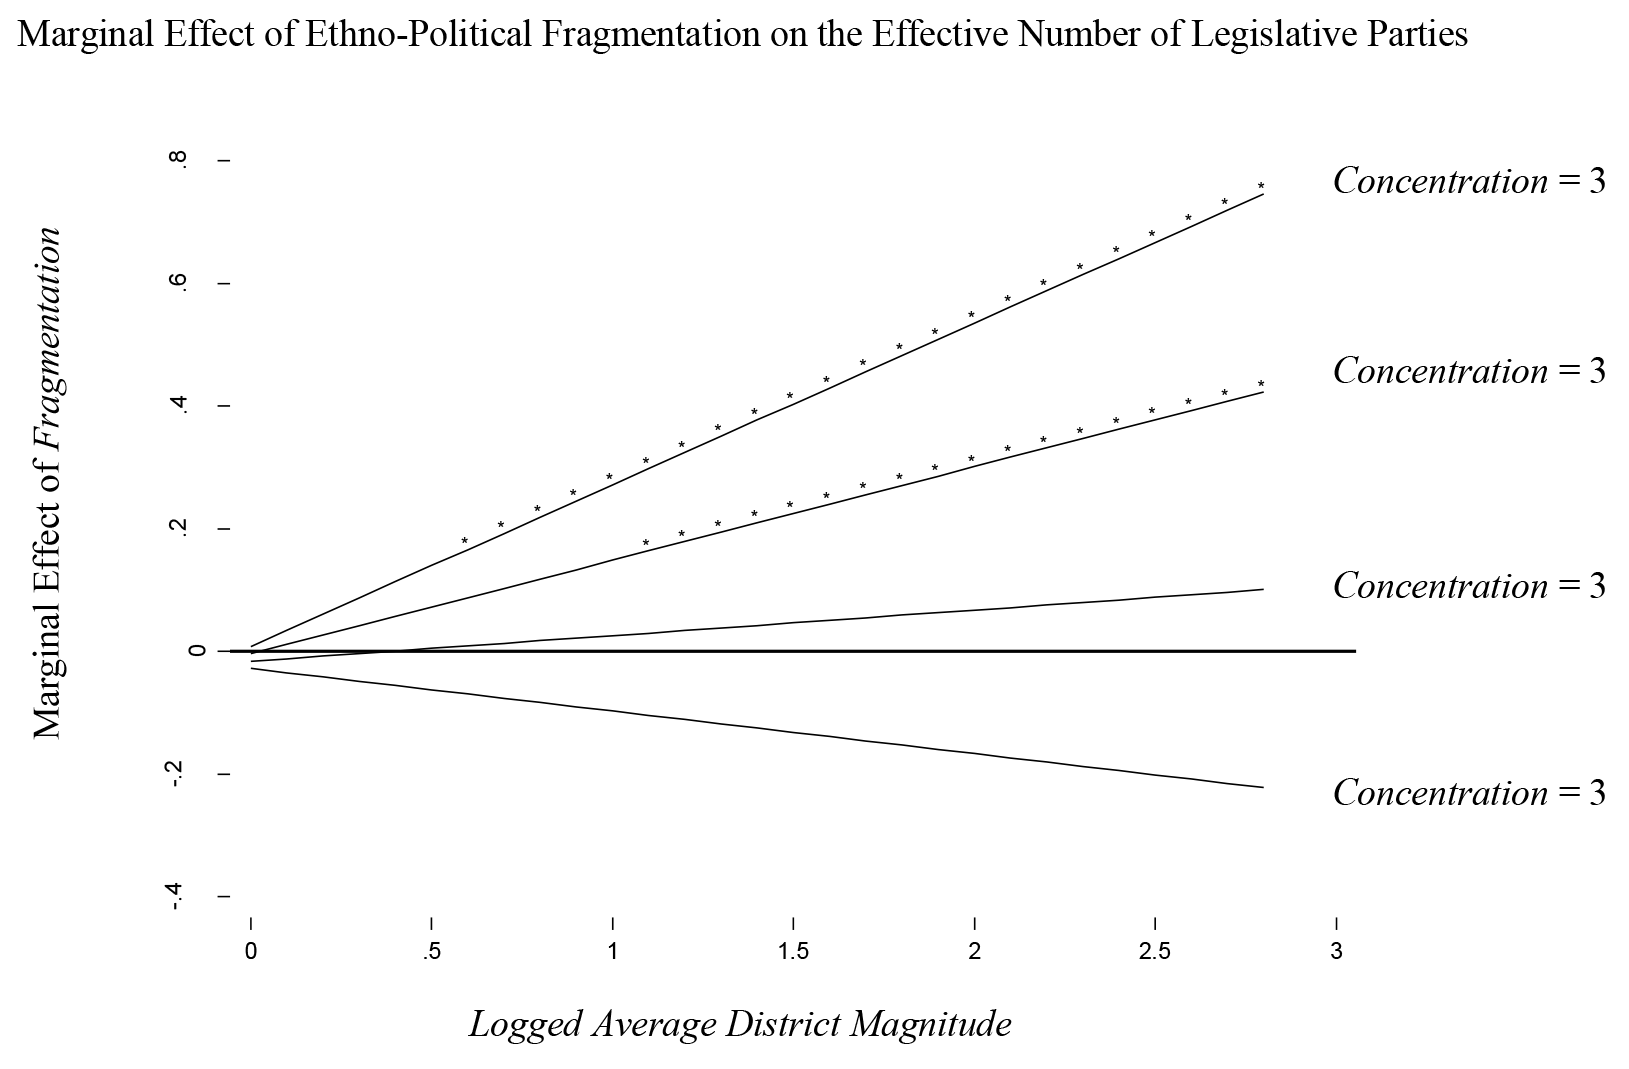
In “Improving Tests of Theories Positing Interaction”, my co-authors and I make several recommendations about the construction of marginal effect plots:
- Conditional theories are typically strong enough to generate predictions about how the marginal effect of X on Y varies with Z and how the marginal effect of Z on Y varies with X. In these cases, scholars should evaluate their predictions by constructing marginal effect plots for both X and Z.
- The horizontal axis of a marginal effect plot should extend from the minimum observed value in the sample for the variable being plotted to the maximum observed value.
- A frequency distribution for the variable on the horizontal axis should be superimposed over each marginal effect plot. Although it depends to some extent on the context, we believe that a combination of a histogram and a rug plot has many virtues.
- Report the estimated product term coefficient along with its t-ratio or standard error somewhere in each marginal effect plot.
An example that follows these recommendations is shown on p. 14 of “Improving Tests of Theories Positing Interaction”. [replication code][detailed explanation of code]
Below you can find Stata code for producing a marginal effect plot for one of the interacting variables, in this case X, based on three different types of multiplicative interaction models. It should be easy to adapt this code to deal with other types of interaction models. Before looking at these specific examples, I suggest examining the recommendations for marginal effect plots shown above. As a reminder, replication code in both Stata and R is available towards the top of this page for all marginal effect plots and other analyses in my 2023 book Interaction Models: Specification and Interpretation.
1. Marginal Effect Plot for X: An Interaction Between X and Z
- [Code][Detailed Explanation of Code]The following example is a marginal effect plot for X based on the results from a linear-interactive model taking the following basic form:
2. “Marginal Effect” Plot for X: An Interaction Between X and Z in a Probit Model
- [Code][Detailed Explanation of Code]The following example is a “marginal effect” plot for X based on the results from a probit interaction model taking the following basic form:


The code for this example can easily be modified to produce “marginal effect” plots for other non-linear models such as duration models, count models, ordered models etc. See the detailed explanation of the code.
3. Marginal Effect Plot for X: An Interaction Between X, Z, and W
- [Code][Detailed Explanation of Code]The following example is a marginal effect plot for X based on the results from a linear-interactive model taking the following basic form:


Standard Errors
The two tables below illustrate a variety of multiplicative interaction models, marginal effects, and standard errors. The tables are based on those in Aiken and West (1991).


Survey of the Literature
In “Understanding Interaction Models: Improving Empirical Analyses”, my co-authors and I conducted a systematic examination of three leading, non-specialized political science journals (American Journal of Political Science, American Political Science Review, Journal of Politics) from 1998 to 2002. During the five year period from 1998 to 2002, we found 149 articles that employed interaction models of one variety or another. We coded each article for whether they implemented the four recommendations that we made in our article. A summary of our results are shown in the table below.
| Recommendation | Yes | No | Total |
|---|---|---|---|
| Include all constitutive terms | 107 (69%) | 49 (31%) | 156 |
| Interpret constitutive terms correctly* | 38 (38%) | 63 (62% | 101 |
| Provide range for marginal effect | 86 (55%) | 70 (45%) | 156 |
| Provide measure of uncertainty | 34 (22%) | 122 (78%) | 156 |
‘Include all constitutive terms’ is self-explanatory. ‘Interpret constitutive terms correctly’ means not interpreting the coefficients on constitutive terms as unconditional marginal effects. ‘Provide range for marginal effect’ and ‘Provide measure of uncertainty’ require the analyst to calculate the marginal effect for some independent variable for at least one value of the relevant modifying variable other than zero and provide some measure of uncertainty such as a standard error or confidence interval. We were very liberal on these last two criteria and coded articles that reported predicted probabilities under two or more different scenarios as having met our recommendations even though these are not marginal effects or first differences (or the quantities of interest). If we had not done this, considerably fewer articles would have been coded as having implemented our recommendations.
A complete list of these articles, along with additional details, can be found by clicking here (Sample). We do not mean to suggest that the conclusions reached in any of these articles are necessarily wrong. After all, we have not conducted detailed reanalyses of all of these studies. However, we do believe that there is a potential for some conclusions in these articles to be incorrect. This is why we encourage people to conduct replications of these studies.
Although my co-authors and I went to great pains to avoid any errors in our survey, we are only human and errors may remain. In some cases, it was hard to code particular articles because it was not always clear how certain variables were constructed or what model specification was actually used. If your article is included in our sample and you believe that it has been erroneously classified, we would be happy to hear from you. Our goal in conducting this survey is not to cause offense but to improve future empirical research. As a result, we will immediately correct any errors.
Replications
In “Understanding Interaction Models: Improving Empirical Analyses”, my co-authors and I listed several articles that estimated multiplicative interaction models that omit at least one constitutive term, interpret the coefficient on constitutive terms as unconditional marginal effects, or fail to calculate marginal effects and standard errors across a substantively meaningful range of the modifying variable(s). We believe that these types of mistakes are so common in the literature that analysts should critically re-evaluate, and where necessary re-specify, models employing interaction terms before using their results as the basis for future research. Substantively different conclusions from those in the original analyses often arise when this is done.
Below we present several replications of analyses using multiplicative interaction models that we have conducted in the course of our own research. We hope that others will also conduct replications of other analyses using such models and will add them to the list below. This might be a useful assignment for a first or second semester class in quantitative methods.
- Golder, Matt. 2003. “Electoral Institutions, Unemployment, and Extreme Right Parties.” British Journal of Political Science 33:3: 525-534. [Replication materials] This is a reanalysis of Jackman, Robert & Karin Volpert. 1996. “Conditions Favoring Parties of the Extreme Right in Western Europe.” British Journal of Political Science 25: 501-521.
- Brambor, Thomas, William Roberts Clark & Matt Golder. 2004. “Gubernatorial and Presidential Coattails in Brazil.” [Replication materials] This is a reanalysis of Samuels, David. 2000. “The Gubernatorial Coattails Effect: Federalism and Congressional Elections in Brazil.” Journal of Politics 62: 240-253.
- Brambor, Thomas, William Roberts Clark & Matt Golder. 2004. “Electoral System Choice.” [Replication materials]This is a reanalysis of Boix, Carles. 1999. “Setting the Rules of the Game: The Choice of Electoral Systems in Advanced Democracies.” American Political Science Review 93: 609-624.
- Brambor, Thomas, William Roberts Clark & Matt Golder. 2007. “Are African Party Systems Different?” Electoral Studies 26: 315-323. [Replication materials] This is a reanalysis of Mozaffar, Shaheen, James Scarritt and Glen Galaich. 2003. “Electoral Institutions, Ethnopolitical Cleavages, and Party Systems in Africa’s Emerging Democracies.” American Political Science Review 97: 379-390.
- Clark, William Roberts & Matt Golder. 2006. “Rehabilitating Duverger’s Theory: Testing the Mechanical and Strategic Modifying Effects of Electoral Laws.” Comparative Political Studies 39: 679-708. [Replication materials] This includes a reanalysis of Amorim Neto, Octavio & Gary Cox. 1997. “Electoral Institutions: Cleavage Structures and the Number of Parties.” American Journal of Political Science 41: 149-174.
- Berry, William D., Matt Golder, & Daniel Milton. 2012. “Improving Tests of Theories Positing Interaction.” [Replication materials] This includes a reanalysis of Kastner, Scott L. 2007. “When Do Conflicting Political Relations Affect International Trade.” Journal of Conflict Resolution 51: 664-688.
- Berry, William D., Matt Golder, & Daniel Milton. 2012. “Improving Tests of Theories Positing Interaction.” [Replication materials] This includes a reanalysis of Alexseev, Mikhail A. 2006. “Ballot-Box Vigilantism: Ethnic Popuation Shifts and Xenophobic Voting in Post-Soviet Russia.” Political Behavior 28: 211-240.